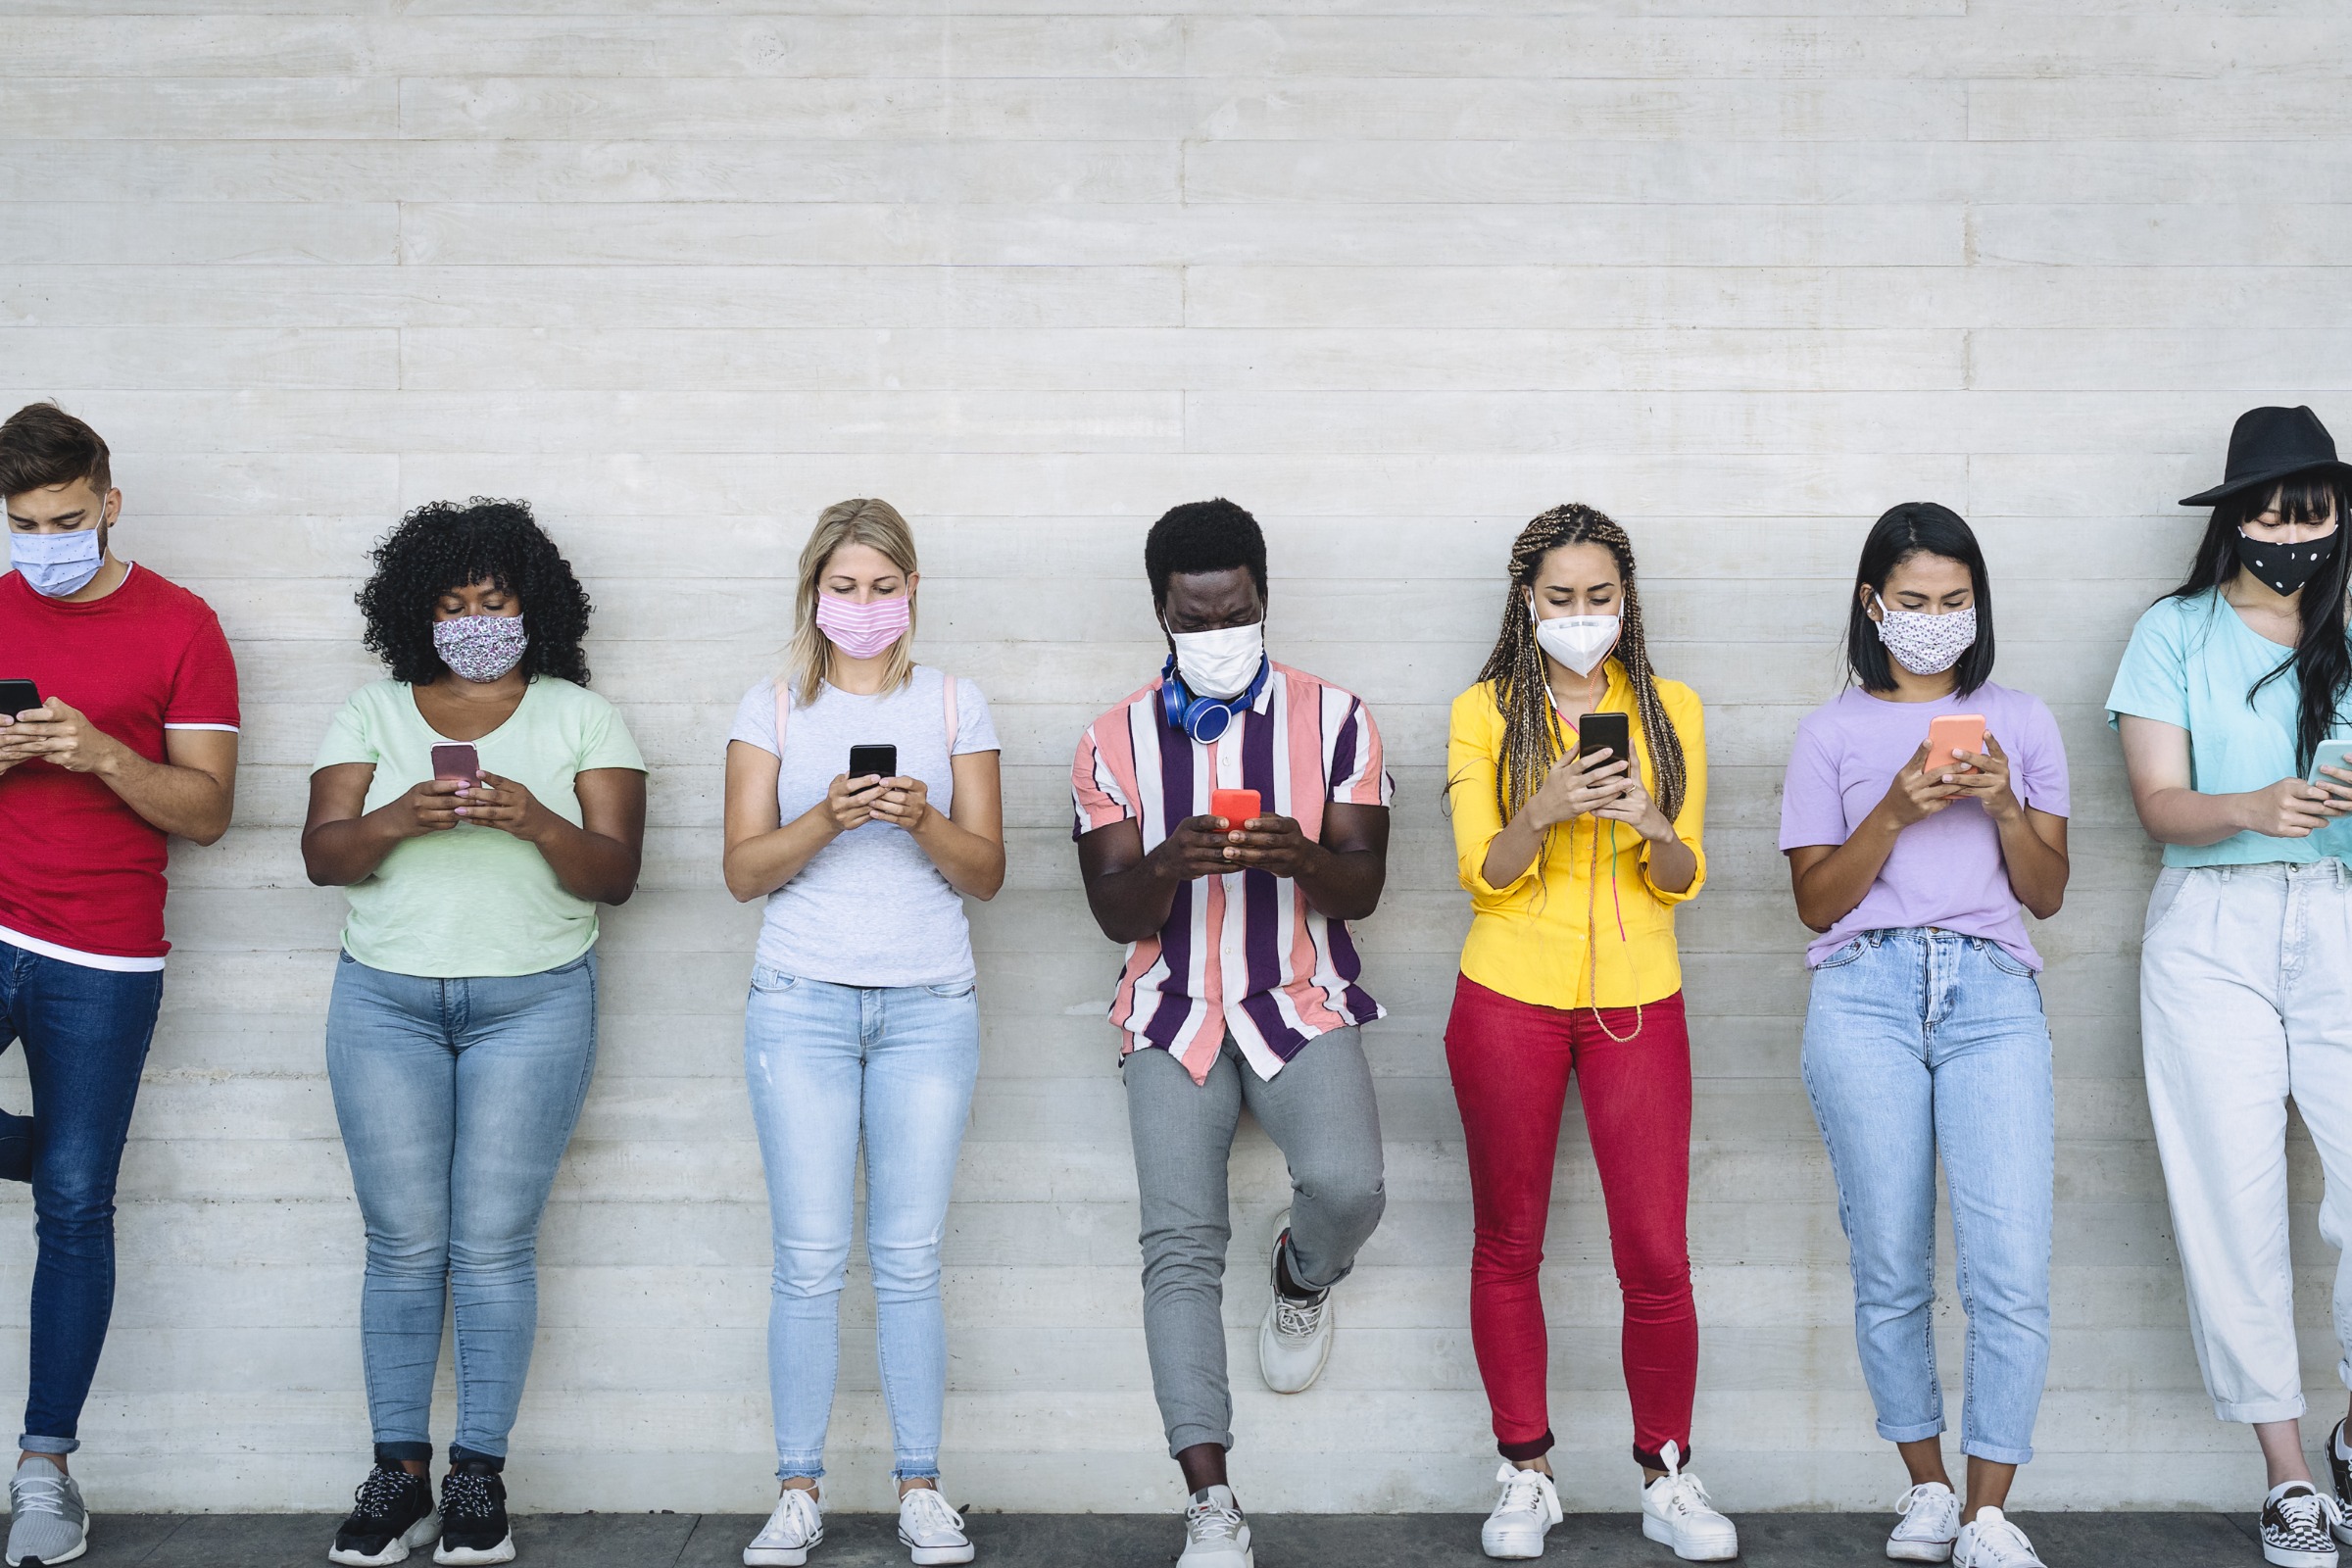

COVID-19 has spared no generation, but has put a unique burden on Gen-Zers—the roughly 67 million Americans born between 1997 and 2012—who are just entering the workforce, starting college, or graduating high school amid an international pandemic.
Despite the coronavirus grinding everyday life as we know it to a halt, the Gen Z demographic is still charting its courses as these young adults choose cities to start building their lives, look for education and job opportunities, and enter into adulthood. To that end, certain American cities do better than others at courting budding entrepreneurs, advocates, artists, and experts in tech.
Sublet.com, owned by Nestpick Inc., compiled a list of the top 10 U.S. cities for young people based on Nestpick’s 2019 Generation Z City Index, which focuses on a selection of cities best suited for this demographic’s diverse variety of lifestyles and work values.
The original study ranked 110 global cities based on 22 indicators spanning four major categories: digital, principles, leisure, and business. For each city, a weighted average was applied to create an overall city score indexed from 0 to 100. To adjust for lifestyles during COVID-19, Sublet.com updated the affordability indicator to use mid-2020 data, excluded two indicators from the original study (concerts and co-working spaces), and provided information on the status of COVID-19 locally and how the cities and residents have adapted. Sublet also included recent COVID-19 statistics for each city from the Jan. 3 COVID-19 Community Profile Report released by the White House COVID-19 Task Force.
Gen Zers are hooked on technology, having been exposed to smartphones, laptops, and the internet as infants and young children. They’re characterized as valuing cultural diversity, making meaningful contributions, and tackling issues with passion. This generation openly shares on social media, builds virtual relationships and communities, and typically spends hours each day digitally connected.
Keep reading to see which U.S. cities are best for Gen Z—and what it’s like to live there during COVID-19.

- Total score: 58.06
- Top Gen-Z categories: Government digitalization (94.13), Access to health care (89.58), Right to protest (85.66), LGBTQ+ equality (77.78), Internationalism (40.91)
- COVID-19 statistics (for the Denver-Aurora-Lakewood metro area, Dec. 27 to Jan. 2):
--- 7,533 new cases (254 per 100,000 people, -7.0% change from previous week)
--- 122 new deaths (4.1 per 100K, +3.0% change from previous week)
--- Test positivity rate: 7.4%
Young people have flocked to this Colorado city for its high-tech jobs, lively bar scene, a downtown that’s good for walking to restaurants and shops, and easy access to skiing and other mountain sports. COVID-19 restrictions have limited indoor dining, and outdoor dining is not exactly optimal in a Rocky Mountain winter. Ski resorts can still operate, but non-essential access to the indoors is prohibited.
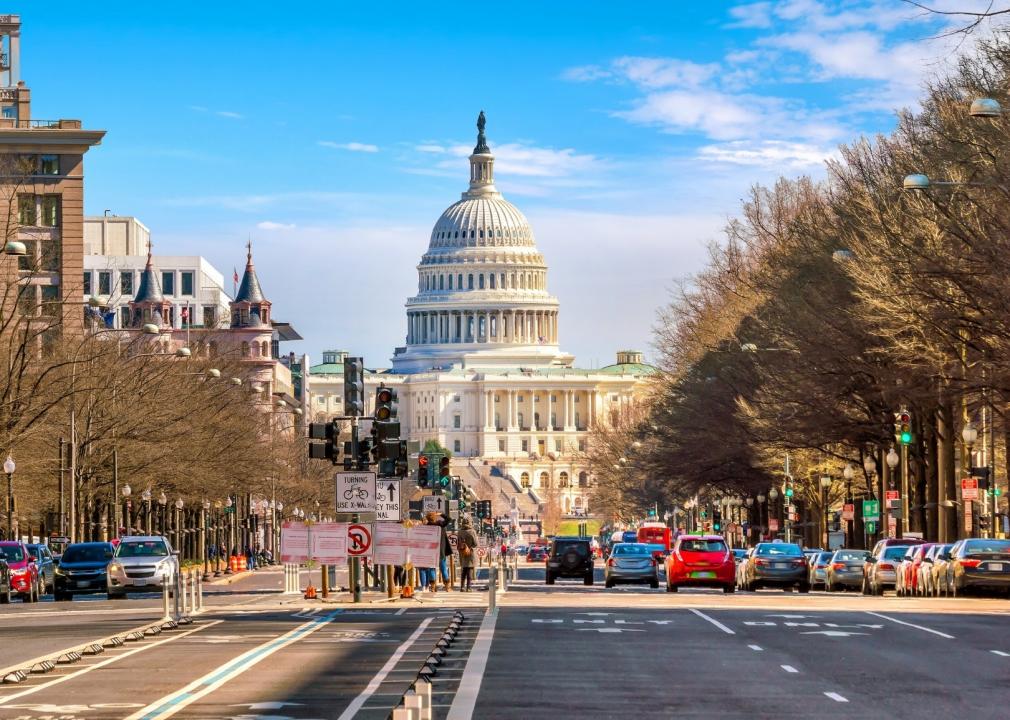
- Total score: 59.31
- Top Gen-Z categories: Government digitalization (94.13), Access to health care (81.19), Right to protest (85.66), LGBTQ+ equality (75.39), Internationalism (37.92)
- COVID-19 statistics (for the Washington-Arlington-Alexandria metro area, Dec. 27 to Jan. 2):
--- 18,794 new cases (299 per 100,000 people, +7.0% change from previous week)
--- 185 new deaths (2.9 per 100K, +22.0% change from previous week)
--- Test positivity rate: 12.3%
As COVID-19 has hit the nation’s capital, its abundance of political, lobbying, and government jobs that would bring Gen Z to Capitol Hill, Foggy Bottom, or Georgetown are largely being done remotely. Protests and demonstrations, a mainstay for D.C. idealists, pack less of a punch with social distancing, and many have been put on pause altogether. The presidential inauguration, a highlight for political junkies, will be trimmed back to only about 1,000 invited attendees this year from the typical 200,000, and the parade down Pennsylvania Avenue that typically attracts millions of visitors will likely be virtual like the summer’s Democratic convention.

- Total score: 62.20
- Top Gen-Z categories: Government digitalization (94.13), Access to health care (82.33), Right to protest (85.66), LGBTQ+ equality (56.10), Internationalism (51.54)
- COVID-19 statistics (for the Dallas-Fort Worth-Arlington metro area, Dec. 27 to Jan. 2):
--- 42,842 new cases (566 per 100,000 people, +60.0% change from previous week)
--- 333 new deaths (4.4 per 100K, +9.0% change from previous week)
--- Test positivity rate: 23.0%
Dallas has been full of promise for Gen Zers, who value digital connectivity, casual work environments, affordability, and recreational options. But the friendly, open atmosphere has been dampened by COVID-19 cases and hospitalizations hitting record highs. The city’s avid sports fans have been sidelined as the Dallas Cowboys have played to deserted stadiums, with a few cardboard cutout characters in the end zones, and the Mavericks are playing basketball in empty or near-empty arenas.

- Total score: 64.23
- Top Gen-Z categories: Government digitalization (94.13), Access to health care (82.45), Right to protest (85.66), LGBTQ+ equality (47.64), Internationalism (44.26)
- COVID-19 statistics (for the Austin-Round Rock-Georgetown metro area, Dec. 27 to Jan. 2):
--- 7,623 new cases (342 per 100,000 people, +43.0% change from previous week)
--- 47 new deaths (2.1 per 100K, +68.0% change from previous week)
--- Test positivity rate: 14.3%
The slogan “Keep Austin Weird” has aptly captured the quirky, progressive character of the Texas city, a unique haven for artists, musicians, indie businesses, vegan chefs, and tech innovators. But the joyful din of the city’s music festivals, performance art, and honky-tonk bars has been dimmed since COVID arrived. The area's iconic vegetarian Mother’s Cafe shut down after 40 years in business, as did Threadgill's, which first opened in 1933 as the city’s first licensed beer joint after Prohibition.

- Total score: 64.82
- Top Gen-Z categories: Government digitalization (94.13), Access to health care (86.81), Right to protest (85.66), LGBTQ+ equality (79.61), Internationalism (47.52)
- COVID-19 statistics (for the Chicago-Naperville-Elgin metro area, Dec. 27 to Jan. 2):
--- 28,185 new cases (298 per 100,000 people, +1.0% change from previous week)
--- 568 new deaths (6 per 100K, -4.0% change from previous week)
--- Test positivity rate: 12.2%
Chicago has emerged as a magnet for young innovators creating startups in the city’s university campus incubators and luring venture capital away from the West Coast to the Windy City. But creative collaboration has taken a hit. Visitors from many other U.S. states have to quarantine for 10 days, city residents are advised to stay home, and universities like Northwestern, the University of Chicago, and the University of Illinois at Chicago have deployed a mix of virtual classes, frequent testing, housing and dorm restrictions, and limits on access to labs and libraries.
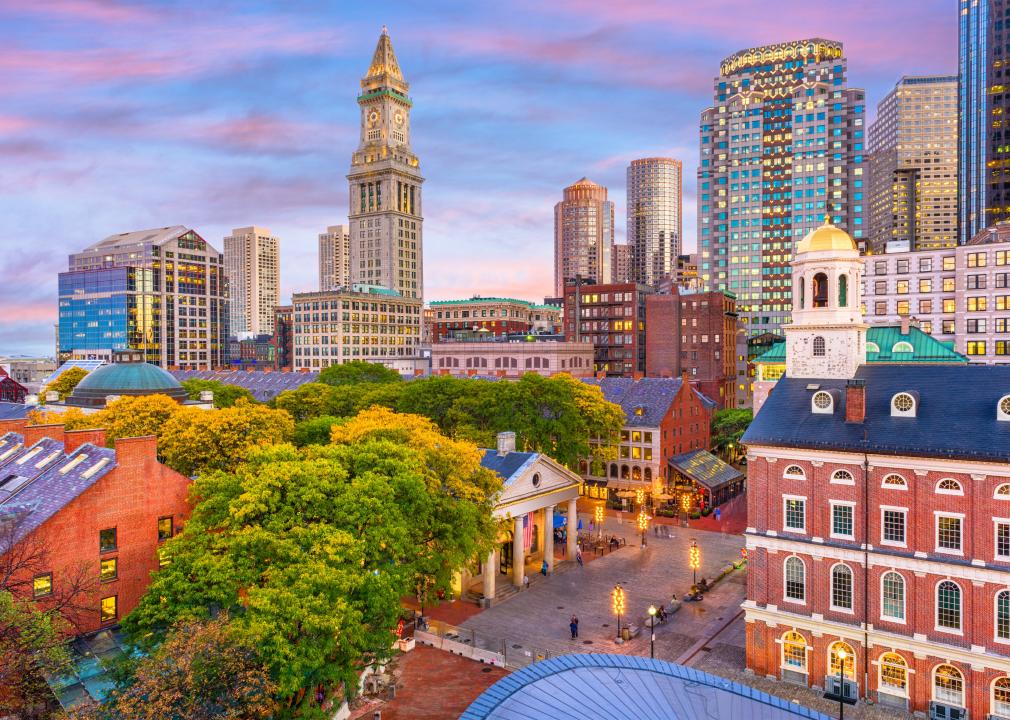
- Total score: 69.32
- Top Gen-Z categories: Government digitalization (94.13), Access to health care (92.75), Right to protest (85.66), LGBTQ+ equality (57.93), Internationalism (54.74)
- COVID-19 statistics (for the Boston-Cambridge-Newton metro area, Dec. 27 to Jan. 2):
--- 22,111 new cases (454 per 100,000 people, +12.0% change from previous week)
--- 289 new deaths (5.9 per 100K, +33.0% change from previous week)
--- Test positivity rate: 8.6%
Boston is a city brimming with young people: Each fall, well over 100,000 students typically arrive to attend one of its 29 colleges and universities and embrace the nightlife, coffee shops, high-tech sophistication, and generally liberal attitudes. In the 2020–21 school year, however, schools cut in-person fall semesters short and Boston University delayed the start of its spring 2021 semester, canceled spring break in March, and vowed to suspend students attending large on- or off-campus gatherings. Health clubs and theaters are closed (as of the beginning of January), bar seating is off-limits, indoor live entertainment is banned, and restaurant customers are limited to 90-minute meals and a 9:30 p.m. curfew.

- Total score: 74.59
- Top Gen-Z categories: Government digitalization (94.13), Access to health care (89.97), Right to protest (85.66), LGBTQ+ equality (85.14), Internationalism (63.55)
- COVID-19 statistics (for the San Francisco-Oakland-Berkeley metro area, Dec. 27 to Jan. 2):
--- 13,646 new cases (288 per 100,000 people, -6.0% change from previous week)
--- 90 new deaths (1.9 per 100K, +8.0% change from previous week)
--- Test positivity rate: 7.6%
San Francisco is a tech industry mecca, attracting creative start-up designers, engineers, and venture-capital investors. The restrictions imposed to limit the coronavirus spread—the city is under stay-home orders and anyone arriving from outside the Bay Area must quarantine 10 days—have brought in-person meet-ups, networking, and brainstorming sessions to a screeching halt. But being innovative has motivated many young, tech-savvy residents to collaborate and build supportive internet connections, sharing ideas and expertise to weather the COVID-19 storm.
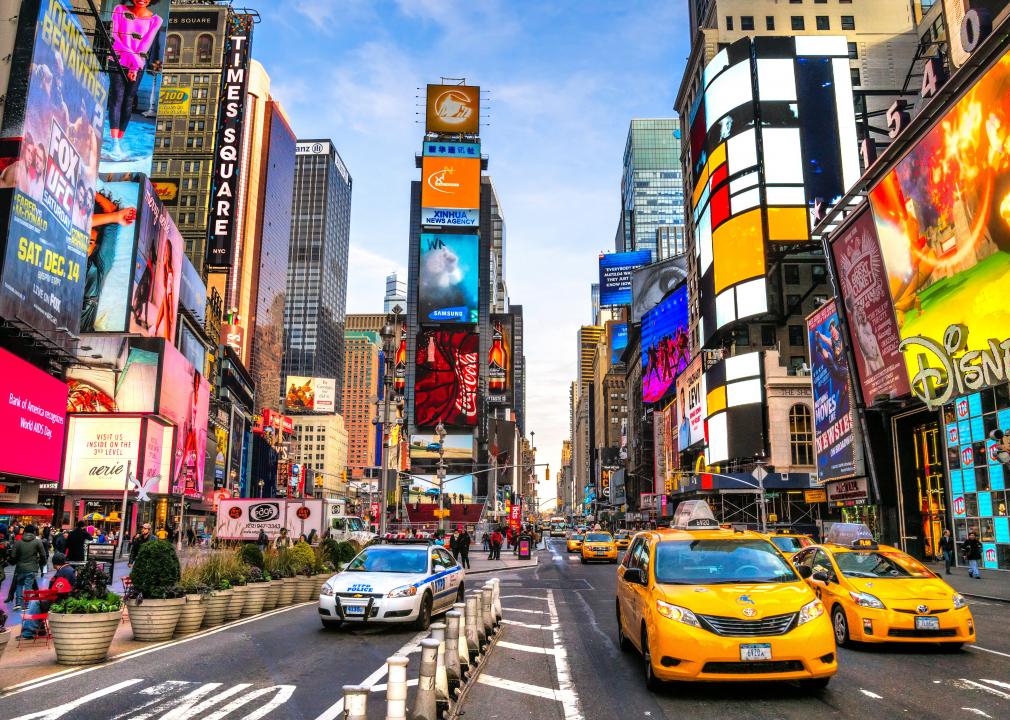
- Total score: 78.21
- Top Gen-Z categories: Government digitalization (94.13), Access to health care (89.26), Right to protest (85.66), LGBTQ+ equality (88.61), Internationalism (65.08)
- COVID-19 statistics (for the New York-Newark-Jersey City metro area, Dec. 27 to Jan. 2):
--- 76,737 new cases (399 per 100,000 people, +9.0% change from previous week)
--- 872 new deaths (4.5 per 100K, +19.0% change from previous week)
--- Test positivity rate: 10.3%
New York has always had something for everyone, Gen Zers included. But the city was one of the earliest COVID-19 hotspots in the nation and imposed strict protocols for masks and social distancing that tamed the spread compared with much of the rest of the country. Broadway, which supports some 97,000 jobs, is expected to be dark at least until summer 2021, and the Metropolitan Opera and New York Philharmonic will be silenced for at least as long.

- Total score: 81.99
- Top Gen-Z categories: Government digitalization (94.13), Access to health care (91.77), Right to protest (85.66), LGBTQ+ equality (77.55), Internationalism (43.71)
- COVID-19 statistics (for the Seattle-Tacoma-Bellevue metro area, Dec. 27 to Jan. 2):
--- 4,063 new cases (102 per 100,000 people, -33.0% change from previous week)
--- 150 new deaths (3.8 per 100K, +285.0% change from previous week)
--- Test positivity rate: 9.1%
Seattle has long attracted young adults to the city’s livability, social entrepreneurship, digitalization, advocacy, environmental activism, music scene, and coffee culture. But Washington state has been at the center of the COVID-19 battle from the very beginning, after a local man was the nation’s first confirmed case in January 2020. State officials recommend quarantine for anyone who has traveled, there’s a statewide mask mandate, and the restaurant industry has shuttered—with many businesses closing permanently.

- Total score: 100.00
- Top Gen-Z categories: Government digitalization (94.13), Access to health care (89.82), Right to protest (85.66), LGBTQ+ equality (81.89), Internationalism (66.49)
- COVID-19 statistics (for the Los Angeles-Long Beach-Anaheim metro area, Dec. 27 to Jan. 2):
--- 120,620 new cases (913 per 100,000 people, +1.0% change from previous week)
--- 1,303 new deaths (9.9 per 100K, +85.0% change from previous week)
--- Test positivity rate: 29.7%
Sunny weather and the dream of a career in Hollywood have always drawn young people to Los Angeles. The city has been caught up in a frightening COVID surge, however, triggering the highest threat level of extreme risk, and residents are under orders to stay home. Movie production suffered, and of the few that have resumed production, stringent protocols have added millions of dollars to costs, and vigilant testing has caused major delays. The latest relief measure in Congress had a five-year film and television tax incentive to boost the industry by allowing producers to expense certain costs rather than write them off as depreciation.
| Digital | Principles | Leisure | Business | Score | ||||||||||||||||||
|---|---|---|---|---|---|---|---|---|---|---|---|---|---|---|---|---|---|---|---|---|---|---|
| Rank | City | Weighted | ||||||||||||||||||||
| 1 | Los Angeles | 94.13 | 91.05 | 63.06 | 43.38 | 49.58 | 96.87 | 60.10 | 66.49 | 61.85 | 81.89 | 74.47 | 69.50 | 89.82 | 70.91 | 85.66 | 89.39 | 95.36 | 53.16 | 74.33 | 60.45 | 89.40 |
| 2 | Seattle | 94.13 | 80.67 | 63.06 | 37.38 | 49.58 | 73.07 | 60.10 | 43.71 | 60.94 | 77.55 | 89.48 | 56.29 | 91.77 | 55.37 | 85.66 | 59.33 | 84.14 | 28.13 | 72.88 | 62.52 | 77.71 |
| 3 | New York | 94.13 | 86.54 | 63.06 | 56.75 | 49.58 | 84.10 | 60.10 | 65.08 | 67.10 | 88.61 | 83.24 | 73.70 | 89.26 | 64.82 | 85.66 | 31.98 | 96.97 | 98.12 | 91.19 | 88.08 | 86.03 |
| 4 | San Francisco. | 94.13 | 86.47 | 63.06 | 60.09 | 49.58 | 52.01 | 60.10 | 63.55 | 61.85 | 85.14 | 83.24 | 69.5 | 89.97 | 71.77 | 85.66 | 19.72 | 89.87 | 65.32 | 87.44 | 100.00 | 83.09 |
| 5 | Boston | 94.13 | 82.41 | 63.06 | 51.67 | 49.58 | 100.00 | 60.10 | 54.74 | 71.19 | 57.93 | 87.41 | 89.12 | 92.75 | 62.81 | 85.66 | 17.36 | 83.91 | 31.91 | 73.20 | 67.36 | 77.45 |
| 6 | Chicago | 94.13 | 87.22 | 63.06 | 34.18 | 49.58 | 74.53 | 60.10 | 47.52 | 58.00 | 79.61 | 81.34 | 65.3 | 86.81 | 69.5 | 85.66 | 15.84 | 87.75 | 38.23 | 74.43 | 57.27 | 76.37 |
| 7 | Austin | 94.13 | 85.52 | 63.06 | 61.81 | 49.58 | 81.75 | 60.10 | 44.26 | 43.55 | 47.64 | 84.29 | 54.95 | 82.45 | 63.12 | 85.66 | 12.31 | 79.10 | 35.48 | 64.60 | 64.48 | 70.41 |
| 8 | Dallas | 94.13 | 88.21 | 63.06 | 44.16 | 49.58 | 42.81 | 60.10 | 51.54 | 43.55 | 56.10 | 83.07 | 54.90 | 82.33 | 64.26 | 85.66 | 20.93 | 83.56 | 24.85 | 57.82 | 45.47 | 69.57 |
| 9 | Washington | 94.13 | 80.51 | 63.06 | 54.67 | 49.58 | 1.35 | 60.10 | 37.92 | 53.51 | 75.39 | 83.24 | 76.94 | 81.19 | 74.49 | 85.66 | 12.08 | 85.14 | 47.04 | 89.14 | 47.81 | 67.99 |
| 10 | Denver | 94.13 | 86.37 | 63.06 | 44.79 | 49.58 | 29.89 | 60.10 | 40.91 | 65.08 | 77.78 | 87.43 | 47.95 | 89.58 | 53.75 | 85.66 | 10.87 | 85.00 | 46.73 | 60.19 | 44.40 | 70.07 |
| 11 | Miami | 94.13 | 80.83 | 63.06 | 28.40 | 49.58 | 42.24 | 60.10 | 82.40 | 50.27 | 83.84 | 88.17 | 57.68 | 87.27 | 49.77 | 85.66 | 13.51 | 83.03 | 26.75 | 49.12 | 40.78 | 76.13 |
| 12 | Portland | 94.13 | 80.52 | 63.06 | 47.32 | 49.58 | 23.12 | 60.10 | 37.92 | 55.73 | 80.61 | 87.72 | 52.27 | 89.77 | 64.81 | 85.66 | 11.96 | 81.46 | 17.03 | 60.99 | 41.43 | 68.36 |
| 13 | Houston | 94.13 | 89.98 | 63.06 | 30.61 | 49.58 | 65.65 | 60.10 | 56.27 | 43.55 | 62.05 | 83.2 | 54.95 | 82.47 | 43.04 | 85.66 | 10.36 | 79.76 | 16.33 | 60.19 | 40.78 | 69.80 |
| 14 | Philadelphia | 94.13 | 80.97 | 63.06 | 33.33 | 49.58 | 79.44 | 60.10 | 35.54 | 50.58 | 68.21 | 81.97 | 56.58 | 86.68 | 27.38 | 85.66 | 11.51 | 84.74 | 21.20 | 59.64 | 40.27 | 66.73 |
| 15 | Detroit | 94.13 | 80.99 | 63.06 | 29.51 | 49.58 | 38.53 | 60.10 | 21.03 | 50.47 | 71.05 | 81.97 | 57.50 | 82.84 | 19.59 | 85.66 | 10.21 | 78.37 | 13.63 | 49.71 | 17.64 | 59.57 |
Following on from previous iterations evaluating the best cities for millennials, the Best Cities for Generation Z focuses on the latest demographic whose oldest members are in the process of graduating from university and entering the workforce. This index is composed of 22 indicators ranking 110 cities worldwide based on their recognition of, and initiatives to prepare for this new, up-and-coming generation.
According to the Pew Research Center, those born between 1997-2012 are considered to be a member of Gen Z. Despite the lack of a definitive boundary separating Millennials and Generation Z, 1996 was selected due to the common key social, political, and technological circumstances that forms the foundation of each generation. Gen Z-ers are known to be digital natives who value security, diversity, and autonomy, and aim to achieve it through pragmatism and determination.
A shortlist of prominent, international cities were selected based on their reputation as destinations to pursue work and education, as well as those who have shown initiative to act on the demands of previous generations such as Millennials and Generation X. Originally, 100 cities were chosen for the final index, however 10 additional locations that are rising in economic strength were included in order to offer a more representative overview. The final selection of 110 cities is further based on the feasibility of collecting extensive, reliable data for the factors used to assess their livability, as well inclusion at a global scale.
The study focuses on four broad categories with the following factors outlined below that determine the extent to which a city is attractive to live for Gen Z and embraces their values.
All factors as well as the overall total are measured as scores, and are valued between 1 and 100, where 1 is the lowest attainable score in the dataset and 100 is the highest. A value of 100 does not mean a city is perfect and has no need for improvement. Instead, it indicates that the city performs the best out of all locations in the index. In a similar regard, a score of 1 indicates that the city performs the weakest in comparison to the other cities in the study. Nevertheless, this does not necessarily imply that the city has no ability to attract Generation Z, nor is it uninhabitable for the demographic in a wider global context.
This score for each factor is obtained directly from the raw data and implements a normalisation of the form:
Score(i) = 99 * ( ( (x(i) - x(min) ) / ( (x(max) - x(min) ) ) + 1
After the collected data was normalised and determined for each factor, a weighted average to create a final score for each overall category (Digital, Principles, Leisure, Business) was calculated and normalised.
The final total score for each city was then determined by calculating the sum of the weighted average score of the indicators under each category, which has been normalised in order to create a final result between 1 and 100 as follows:
TOTAL SCORE = WEIGHTED AVERAGE (Digital factor scores) + WEIGHTED AVERAGE (Principles factor scores) + WEIGHTED AVERAGE (Leisure factor scores) + WEIGHTED AVERAGE (Business factor scores)
The performance of national administrations in e-gov development. The score looks at three indicators including the provision of online services, investments in telecommunication infrastructure and implementing capacity-building in human capital.
Source: 2018 United Nations E-government Development Index.
The measure of a city’s existing high-speed communication infrastructure, as well as its preparedness and willingness to incorporate Next Generation Technology. This score comprises the average mobile and city broadband speeds at a national-level, as well as the availability, trial or planned implementation of localised 5G services.
Sources: Ookla Speedtest and 5G map, testmy.net, cable.co.uk
The measure of a government’s efforts to enable e-payment options, the prevalence of digital payment as a method, and the readiness of a city to embrace cashless transfers. All of the data included in this factor has been collected at a national level.
Sources: 2018 EIU Government E-Payments Adoption Ranking, G4S 2018 World Cash Report, Hootsuite/We Are Social 2018 Global Digital Report.
The strength of a city’s peer-to-peer (P2P) ecosystem, with a focus on online shared mobility services such as bike-sharing and ride-hailing. The score for this factor uses both city-level and national-level data.
Sources: 2018 Timbro Sharing Economy Index, 2019 Coya Bicycle Cities Index, ADL 2018 Future of Mobility Report, 2019 Easypark Smart Cities Index, Uber, Bike Share Map, and other sources.
The measure of mobile social media use, as well as the percentage of residents using digital services to manage daily life events and stay informed. The score for this factor uses data at a national level.
Source: Hootsuite/We Are Social 2018 Global Digital Report.
The extent to which cities offer students the educational means to be prepared for a technology-driven, knowledge-based world. The score is comprised of the number of higher education institutions which offer degrees in computer science, technology, and innovation-focused programmes within a 200km radius of a city centre.
Source: Times Higher Education 2019 World University Rankings
A measure of the commitment a government has to protect user privacy and online security. The score includes the scope of digital privacy legislation, the prohibition of VPNs, as well as the level of security for an internet user’s personal information. The data for this factor was collected at a national level.
Sources: The French National Commission on Informatics and Liberty (CNIL), National Cyber Security Index, Kaspersky, TheBestVPN
The percentage of foreign-born citizens in a city measured as a score. City-level data was used for this factor, except for Doha where national-level data was used to estimate its value.
Sources: OECD, Eurostat, George Washington University department of Globalization, Urbanization and Migration, official statistics departments, other sources.
Gender parity measured as a score at a national-level. Values include data on health, political empowerment, educational attainment, economic opportunity and participation at a national level for both men and women.
Additional state-level data was used for U.S. cities.
Sources: World Economic Forum Global Gender Gap Report, WalletHub Best States for Womens’ Rights.
A measure of a city’s acceptance towards the LGBT+ community at a social and legislative level.
Sources: Nestpick Best LGBT Cities, Spartacus 2019 Gay Travel Index, Teleport, Nomadlist.
The performance of national government initiatives to promote sustainability and environmental health, as well as the annual mean pm2.5 (ug/m3) at a city-level.
Sources: 2018 Environmental Performance Index, World Health Organisation, Berkeley Earth, other sources.
The accessibility and effectiveness of governments in implementing mental health policies aimed to care for individuals with mental health illnesses and assist their integration into society. The factor uses national data, and state-level data for US cities.
Sources: Jannsen/EIU Mental Health Integration Index, Institute for Health and Metrics Evaluation, local statistics departments.
The level of accessibility residents have to quality healthcare services. Scores for this factor use country-level data which evaluates the costs, accessibility and outcomes of healthcare. For U.S. cities, state level data was used.
Source: Institute for Health and Metrics Evaluation
The degree of safety experienced by members of society at a city level. The score includes aspects such as personal and infrastructural security, as well as perceived safety by individuals.
Sources: EIU 2017 Safe Cities Index, 2019 Global Residence Index, Social Progress Index, FBI, Eurostat, other sources.
The freedom of residents to assemble and organise without fear of retaliation. The score measures the existence of legislation protecting demonstrators, NGOs and labour/trade unions, and accounts for the degree of violent protests and political terror. This indicator uses country-level data.
Sources: Freedom House, 2019 Global Peace Index
The extent to which a city is equipped to foster a h5 esports culture. This score considers city-level data on the number of major esports tournaments, average maximum internet speed, the number of gaming companies, a city’s reputation for being a gaming hub, and the national percentage of global traffic on Steam, a video game digital distribution platform.
Sources: Esportsearnings.com, Steam, Testmy.net, Ookla, Gamedevmap, Centurylink, Lionbridge.
The ease of starting a business and strength of the existing start-up culture in a city, supplemented by the level of knowledge, technology, and creative outputs at a national level. The score includes the necessary costs and time dedicated to incorporating a business, the number of start-ups in a city, and the strength of a logistics ecosystem.
Sources: World Bank Doing Business Report, Global Innovation Index 2019, AngelList, Crunchbase, Cargo Facts 2016, other sources.
The score is based on the cost of living per month at the city level.
Source: Numbeo City Price Index
The number of “social entrepreneur” start-ups per city registered on Crunchbase, and the perceived level of support and favorability of conditions to start and grow a business. There is no firm consensus on a definition for “Social Entrepreneurship”, however to guide this research, it is defined as both profit and non-profit ventures which focus on maximising gains in social satisfaction, rather than maximising profit. Crunchbase search terms included: ‘Sustainability’, ‘CleanTech’, ‘GreenTech, ’Microlending’, and ‘Non-profit’.
Sources: Crunchbase, Reuters Poll - Best Places to be a Social Entrepreneur 2019, Baron, David P. "Corporate Social Responsibility and Social Entrepreneurship." Journal of Economics & Management Strategy.
The number of businesses associated with artificial intelligence in a given city, as a score. Crunchbase search keywords included: ‘Artificial Intelligence’, ‘Machine Learning’, ‘Predictive Analytics’, ‘Natural Language Processing’, ‘Intelligent Systems’.
Sources: Asgard 2018 Global Artificial Intelligence Landscape Database, Crunchbase
Location not found. Use advanced search below.